Historical Partogram
A printable clinical record for reviewing a patient's full labour history.
Designed for clinicians, legal teams, and the patients themselves. Built on a platform used by 2,000+ hospitals worldwide.
Company
Cerner
My Role
UX Designer
Duration
4 Months
Tools used
Sketch, Miro, InVision
Team
Utkarsh Babbar (UX), Binish Chinnu(Dev), Namratha Bangre(Product Owner), Nida Aqil (Senior UX), Denisa Pricopi (Human Factors), Engineering (US + India)
TL;DR
~ 2 min read
CONTEXT
Once labour ends, clinicians need to review what happened. It can be days later, years later, or as legal evidence.
The Historical Partogram is the printable PDF record that makes that possible on Oracle Cerner's platform.
PROBLEM
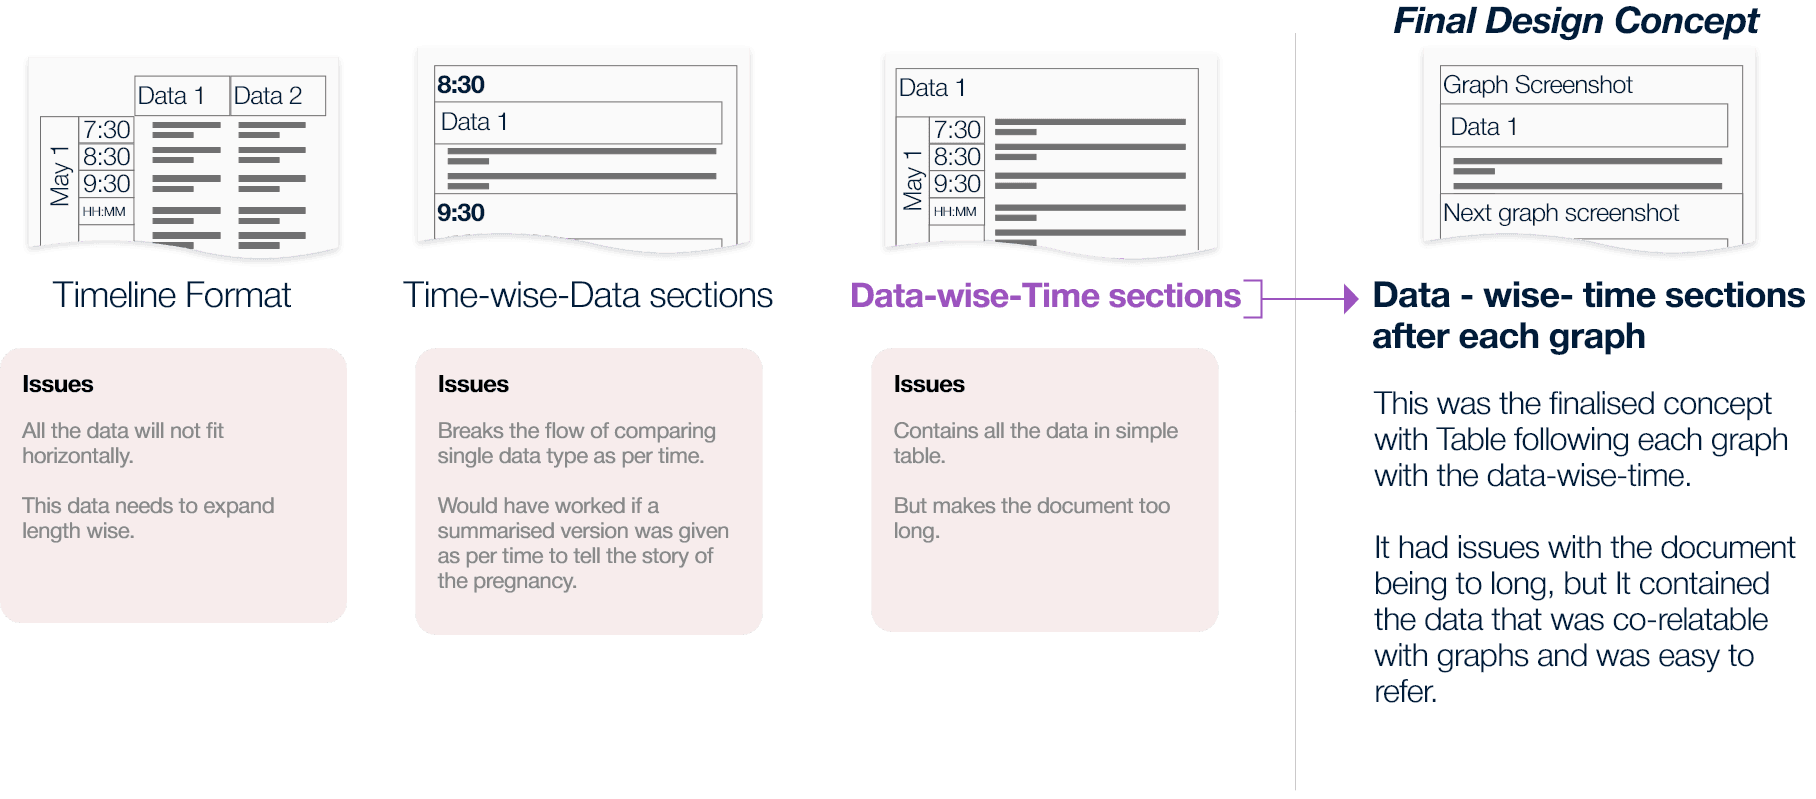
The live Partogram is a graph. The historical version needed graph and data values readable together — a clinician looking at a spike needs the corresponding numbers immediately. Every structural approach either broke readability or broke clinical thinking. And midway through, I discovered the brief had assumed a single user. Patients also receive this document — with no one to explain what it means.
SOLUTION
Data-wise-time structure: graph screenshot with a timestamped data table below each section.
Timestamps on every page after testing. Progressive disclosure expanded by default for legal use. Proposed a patient-facing AI summary (not shipped).
IMPACT
94% SUS score. 5 of 6 clinicians completed all tasks with no issues. One usability finding resolved before handoff.
Colour-coded labour curve confirmed as a critical reading aid.
CONTEXT
PROBLEM
For clinicians
Preserve the clinical utility of the interactive version. The same confidence, the same reading speed — but now in a format with no clickable sections, no expandable panels, no live navigation. Every piece of information had to be findable through layout alone.
For patients
The document also needed to be printable and handed to patients to carry into future pregnancies. Clinical data, medical terminology, graph plots — given to someone with no clinical training and no one in the room to explain it.
LAYOUT EXPLORATION
I explored several layout orientations before settling on the structure. Landscape emerged as the strongest option, it supported time-based visuals more naturally and gave enough horizontal space for graphs and data to sit without feeling compressed. I proposed it to the team and made the case for it.


The orientation tradeoff
I recommended landscape, it gave the graph and data table room to breathe and kept related information visually closer together. The team preferred portrait. It was easier to develop, matched existing documentation standards, and fit the 6-week engineering window. Portrait shipped. Landscape stayed as a future recommendation, not a compromise I was unaware of, but one I documented explicitly.
THE SIGNAL OVERLOOKED
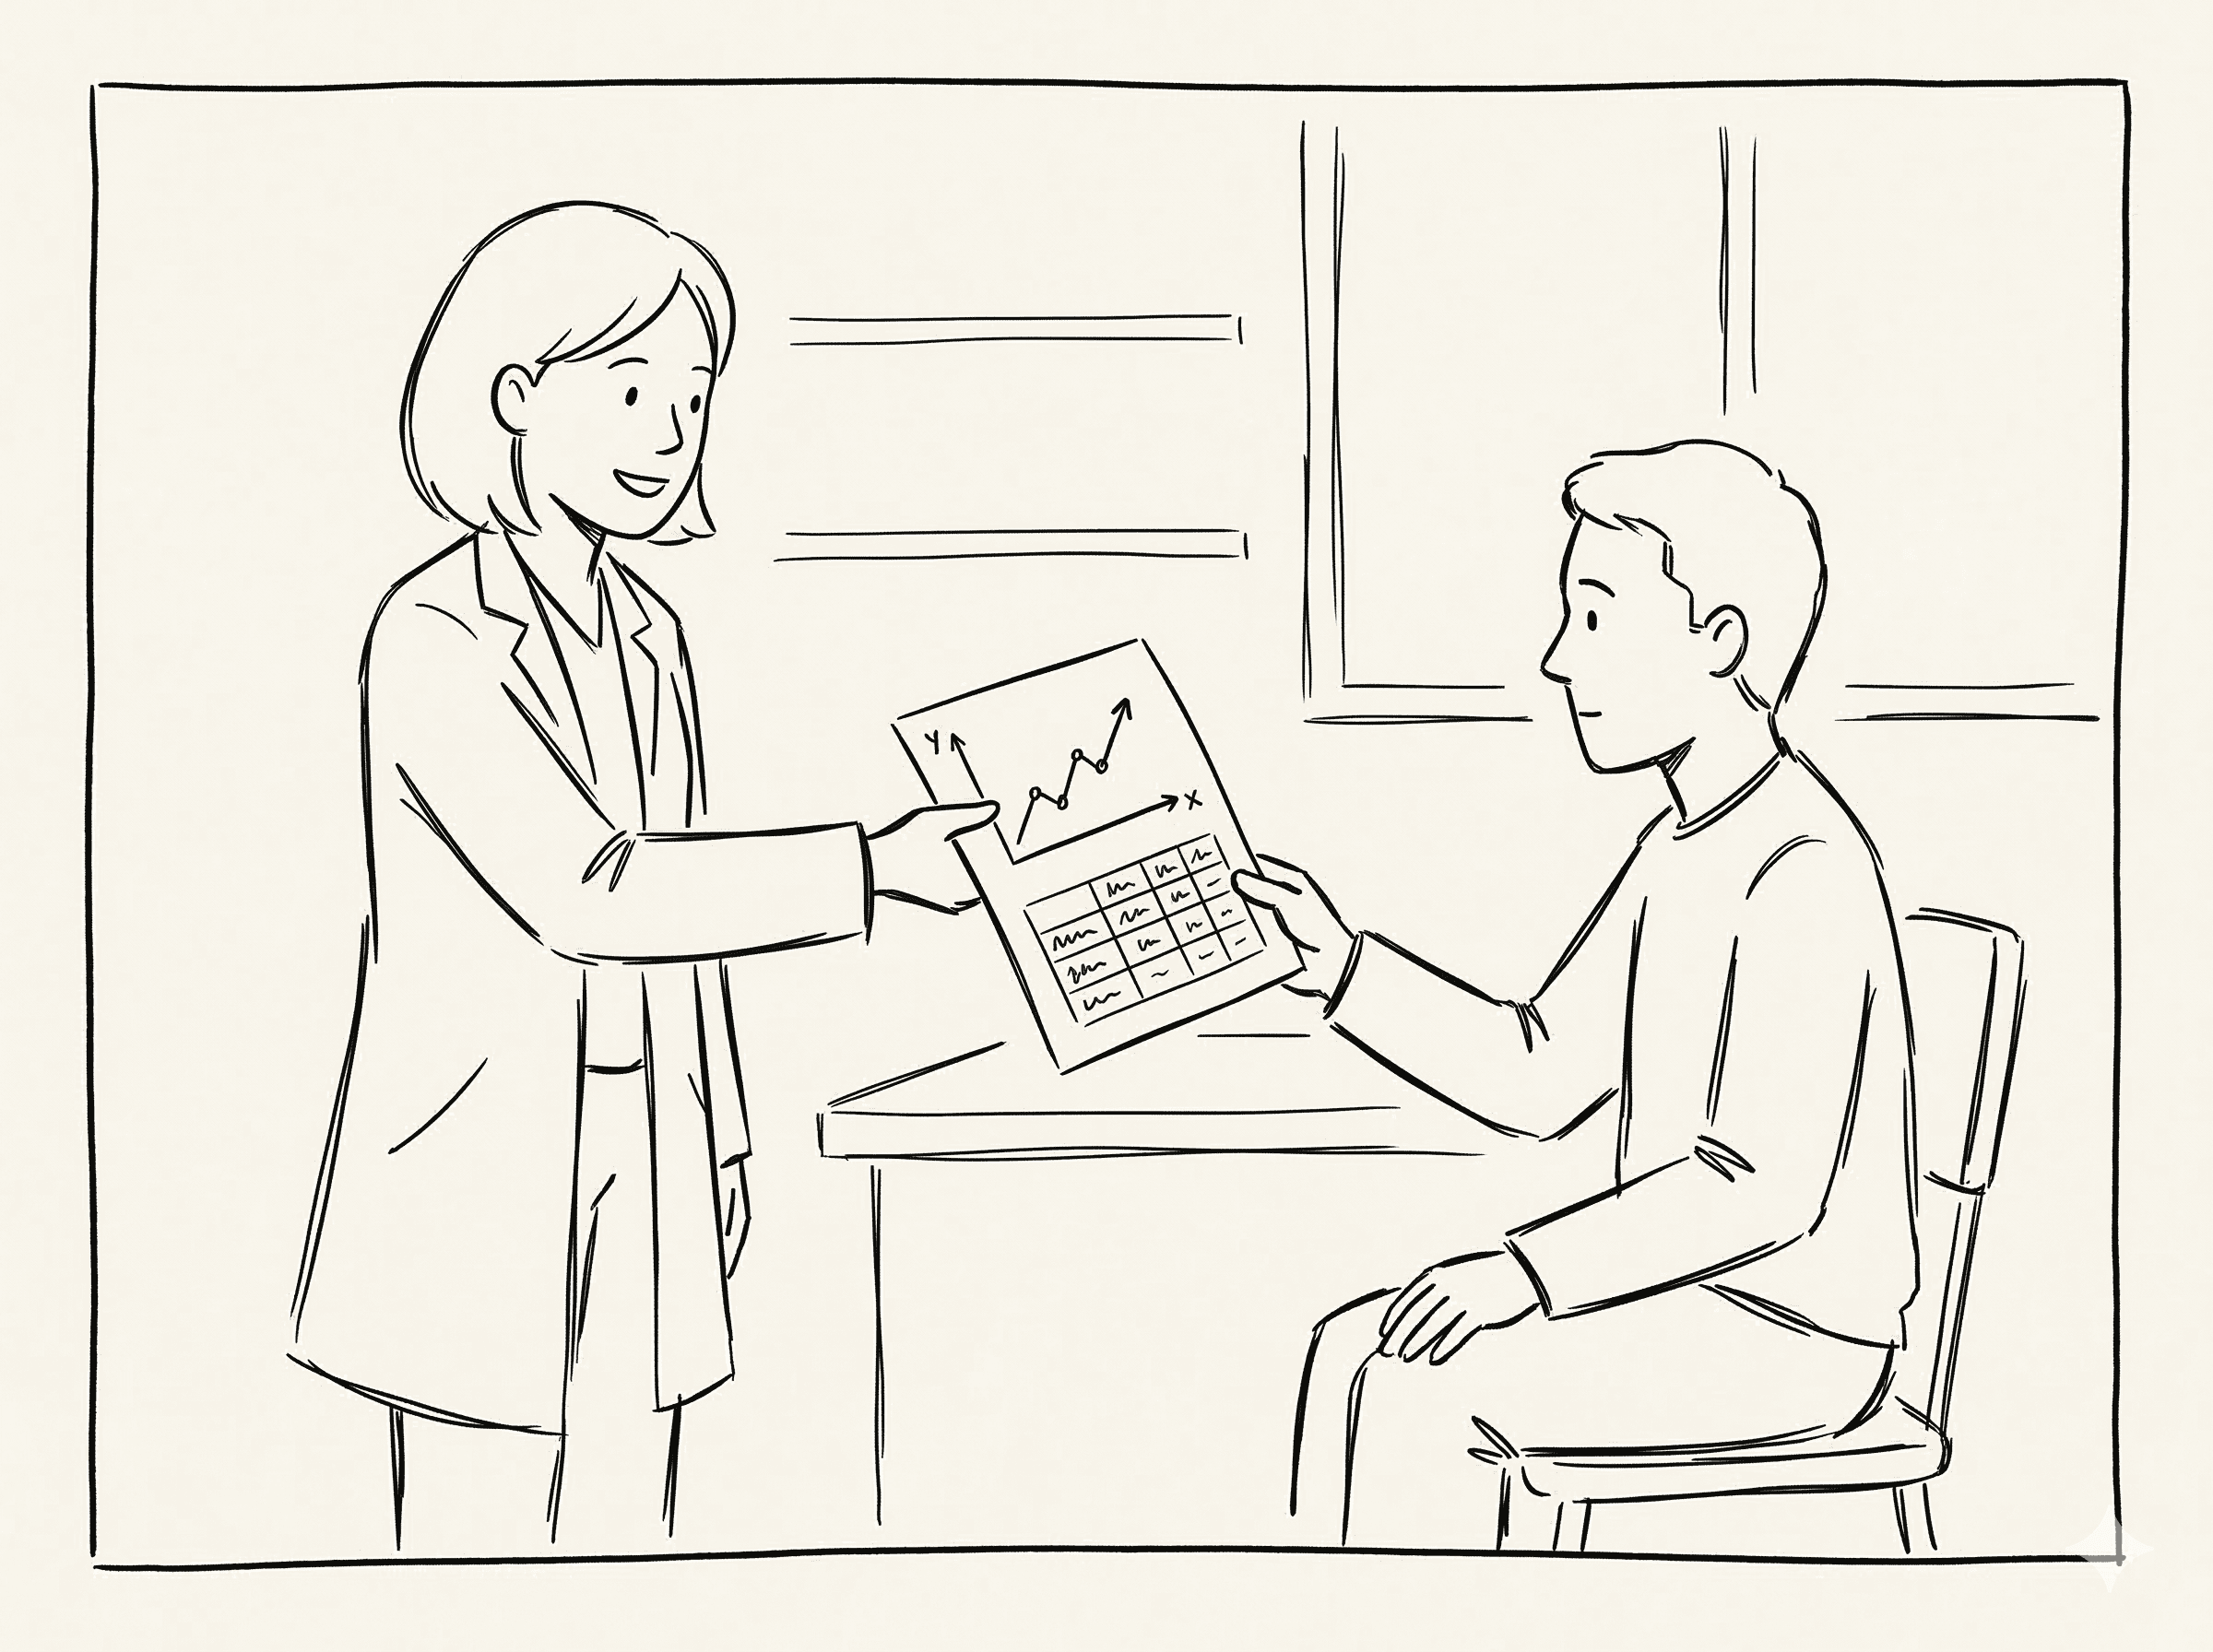
Handoff
A document designed for clinicians, handed to patients
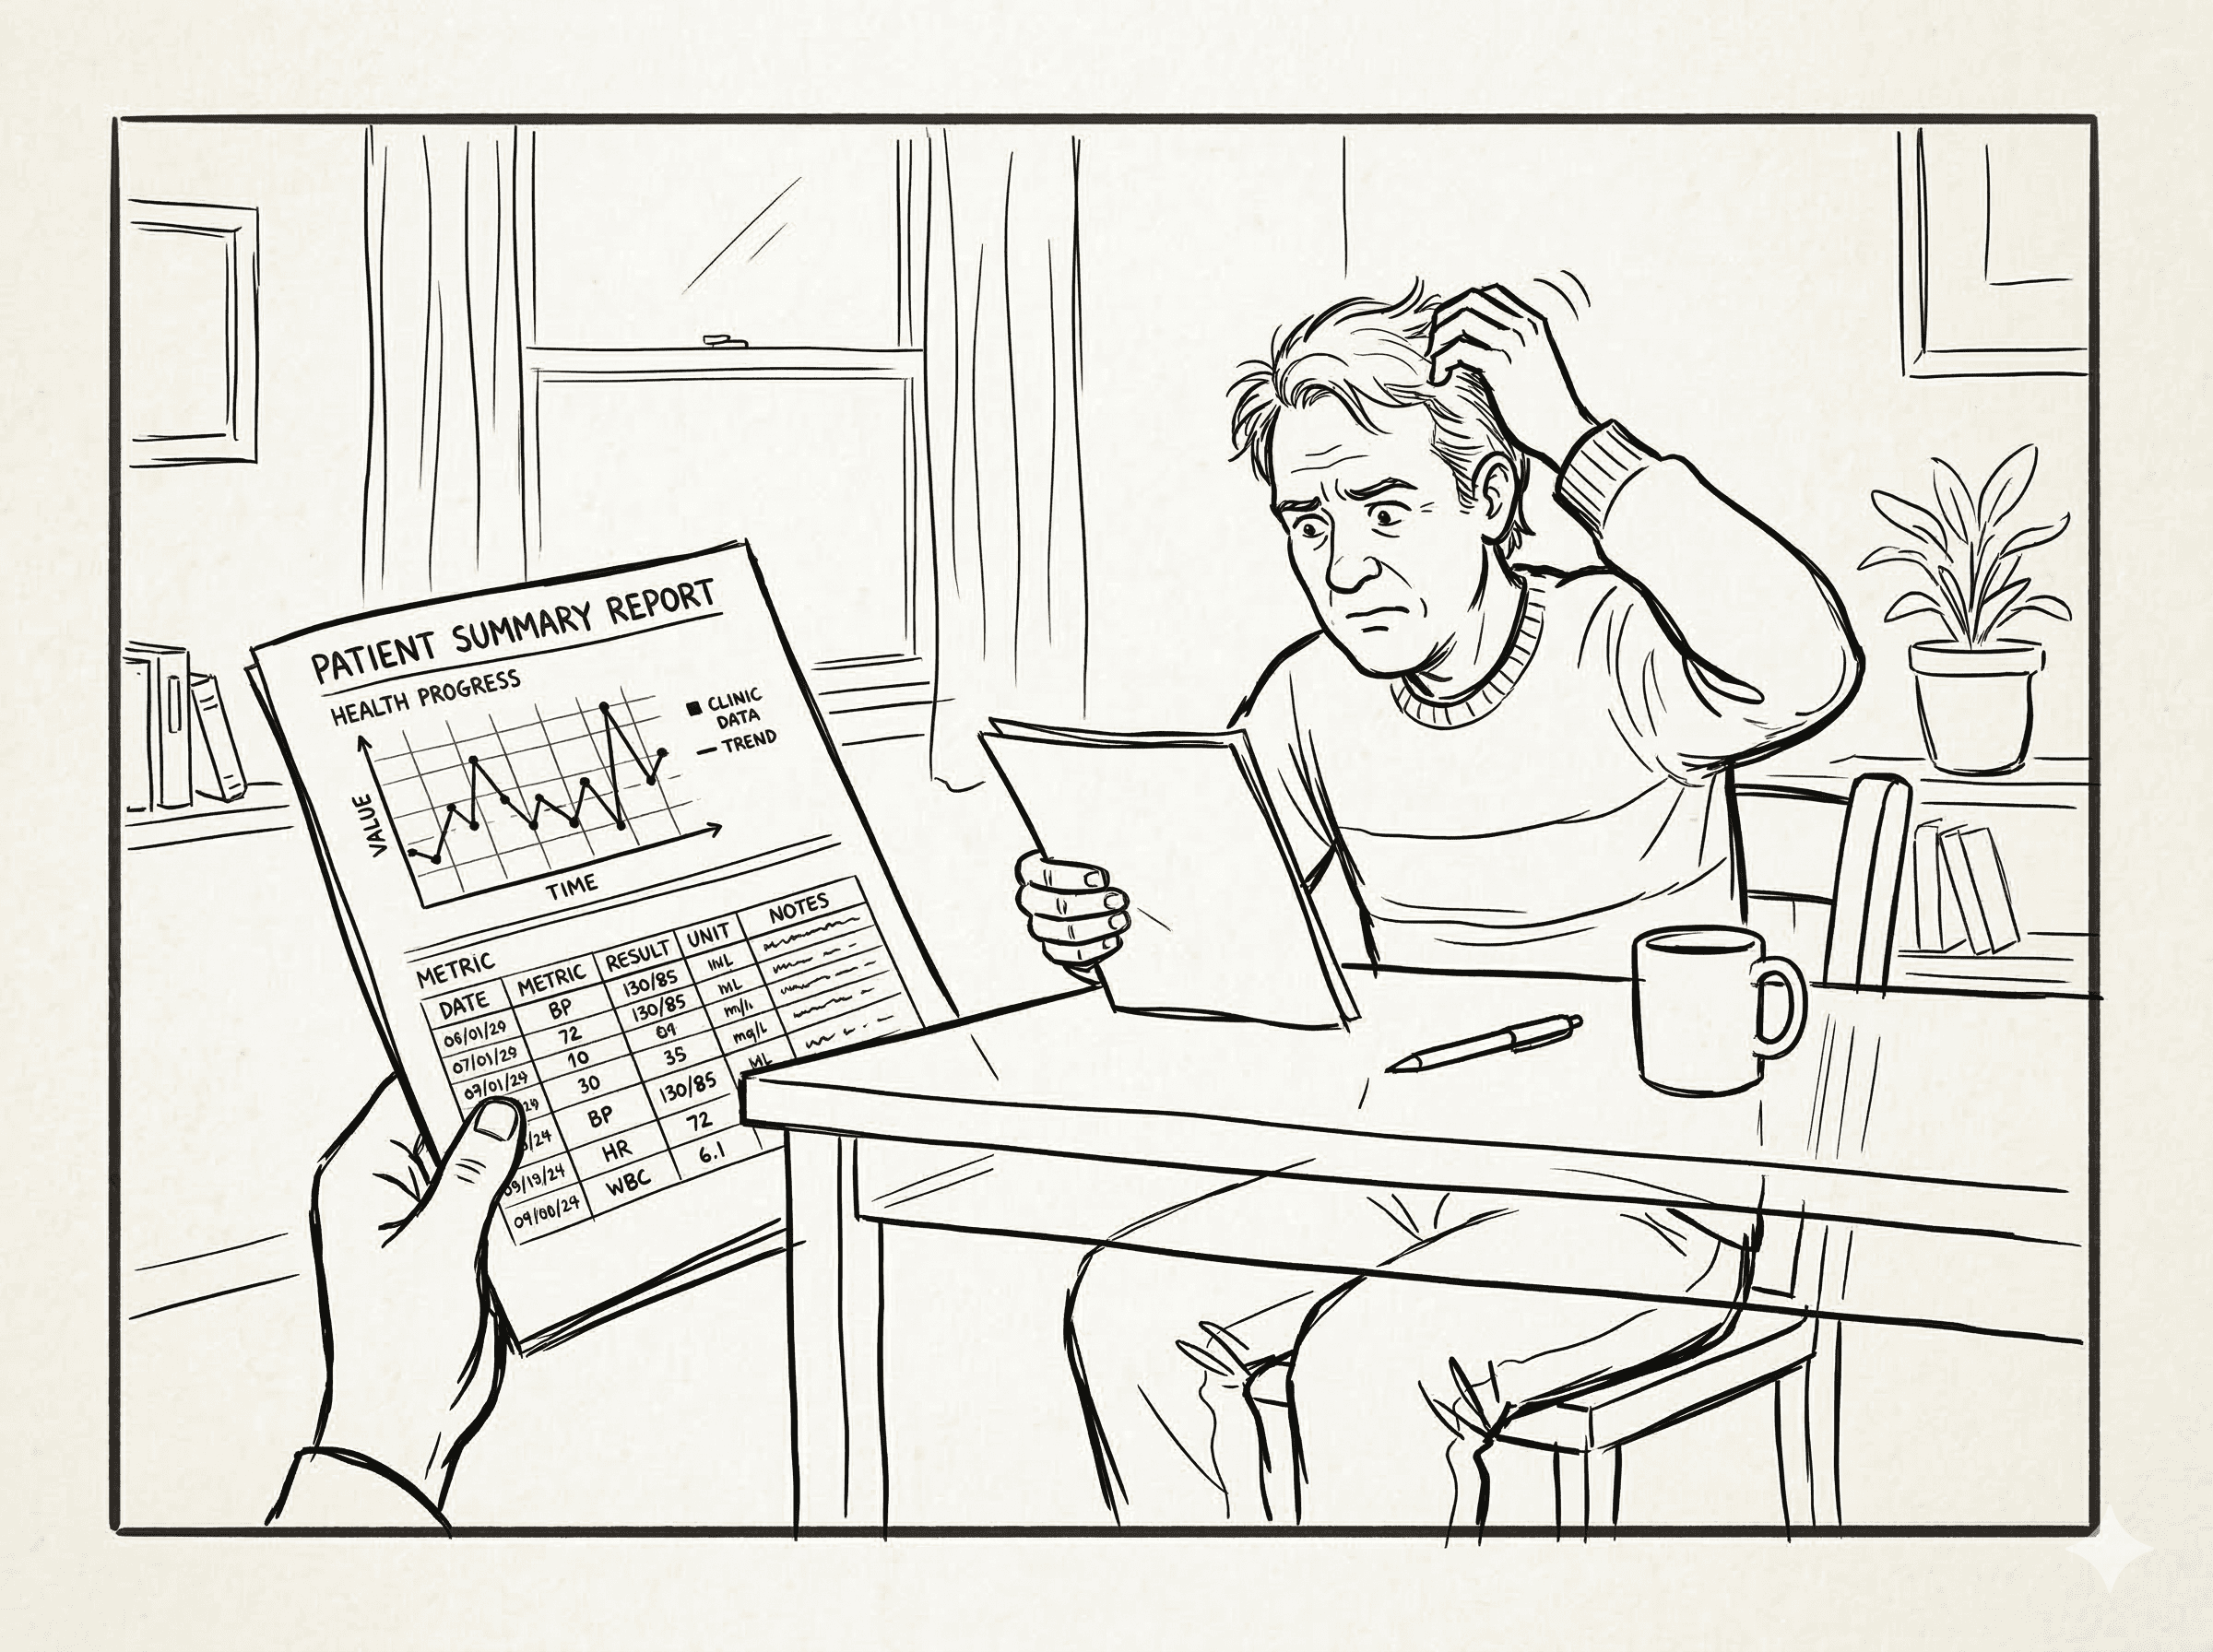
The Gap
A patient alone with a document they cannot read
Nobody hands you an X-ray and expects you to read it. There's a doctor in the room translating it. This document had no translator.
I proposed a plain language AI-generated summary — clearly marked as computer-generated — giving patients a readable account of their own labour. It was rejected on scope and timeline grounds. But I kept it alive in a future exploration section as a genuine handoff to whoever picks this up next. This is the thing I am most proud of on this project. Not because it shipped — it did not — but because noticing it was not my job.
SOLUTION
What shipped and why each decision exists
The final document was built around one principle: every piece of information should be findable fast, even in a legal review months later.
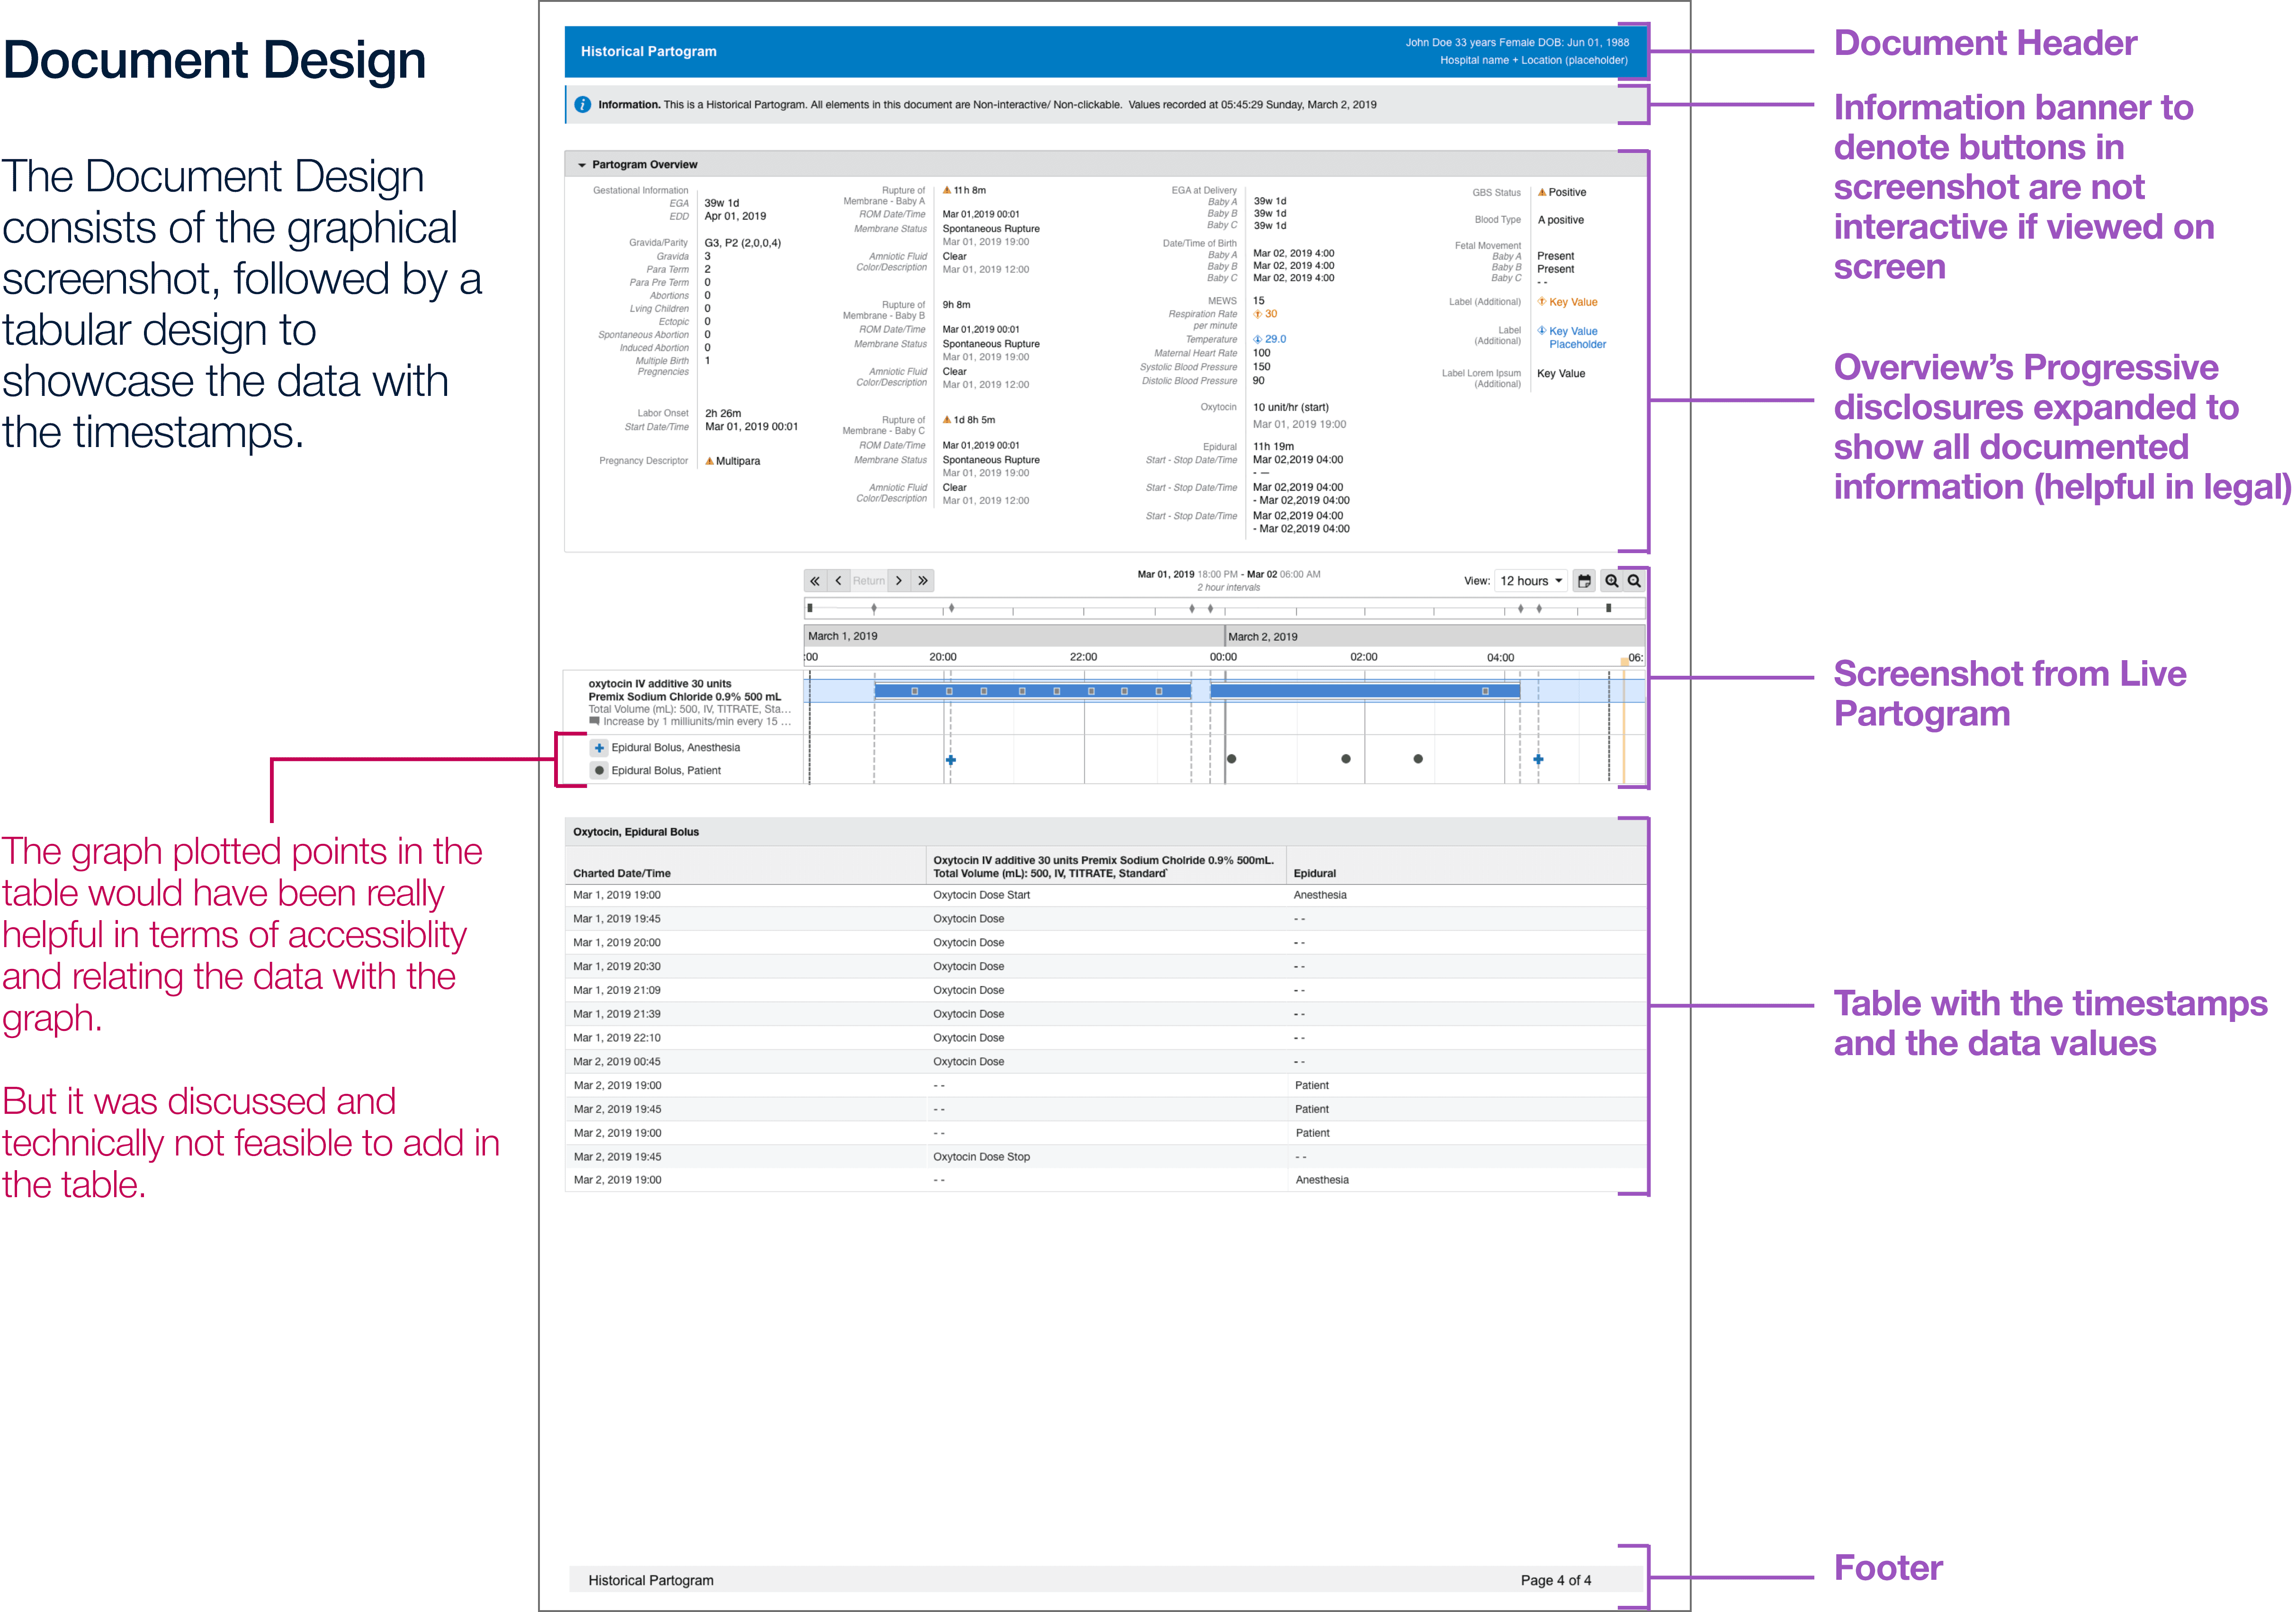
01
Patient header
Document header with patient details and date range — essential for legal identification across all use cases.
02
Graph screenshots
Sequential screenshots from the live Partogram, preserving the colour-coded labour curve that testing confirmed clinicians relied on immediately.
03
Data tables below each graph
Timestamped data table below each graph section — keeping recorded values correlatable with the curve above.
04
Interactive button banner
Information banner clarifying that buttons visible in screenshots are not interactive — preventing clinical confusion in a static document.
05
Progressive disclosure
Overview sections expanded by default — critical for legal use cases where all documented information must surface without extra steps.
06
Timestamps everywhere
Added to the top of every section and page after usability testing flagged that clinicians were losing their place while scrolling.
PROPOSED BUT TECHNICALLY NOT FEASIBLE
Landscape orientation
Graph and data table side by side, directly correlatable without scrolling. Recommended to the team — ruled out because portrait matched existing documentation standards and fit the 6-week engineering window. Documented as a future direction.
Clickable index on page one
An index section on the first page listing all document sections with anchor links — so when opened on a clinical system, a clinician could click directly to the relevant graph or data table without scrolling through the full document. Raised during the design phase. Not feasible within the static PDF constraints of the engineering window.
Both proposals were documented and handed off to the product team as directions for future iterations.
IMPACT
Tested with the people who actually use it
Six clinicians, three nurses and three midwives, a mix of UK and US practitioners, tested against real clinical tasks. The session was run by Denisa Pricopi, Human Factors Researcher at Cerner, with cross-functional stakeholders attending.
System Usability Scale — exceeding 94% of applications in the benchmark database
What the testing found
5 of 6 participants completed all tasks with no issues
✶
Colour-coded labour curves were immediately useful — visual encoding did the work that interactivity previously did
✶
Anesthesia information: 100% task completion. Cervical effacement data: 100% comprehension
✶
One screenshot clarity concern raised — resolved before handoff with clearer labels throughout
✶
Final design delivered within the 6-week engineering window using existing data infrastructure
The finding that validated everything
All 6 participants tried to click or hover on the Historical Partogram expecting interactive behaviour — even though the document was clearly marked "read-only." Only 3 noticed the designation before attempting interaction. Clinicians weren't being careless. They were reaching for a tool that used to be there. This confirmed that the design problem was real: replacing an interactive clinical tool with a static format creates an expectation gap that layout alone cannot fully close. It also made the case for the future interactive concept more clearly than any design document could.
LEARNINGS
What I would do differently and what comes next
WHAT WOULD I PUSH FOR
The landscape layout case
I recommended landscape and the team chose portrait for valid reasons — dev timeline and documentation standards. I would make the case earlier, with a more concrete engineering estimate, before orientation decisions get folded into the release plan. Once the window is set, it is much harder to reopen.
WHAT WOULD I NAME IN THE BRIEF
Patient literacy as a design requirement
The patient handoff was a stated requirement — but nobody had thought through what it actually means to hand a clinical PDF to someone with no medical training. That gap should have been a scoping question from day one, not something discovered mid-project.
WHAT TESTING CONFIRMED
The interactivity gap is structural
Every participant tried to interact with the static document. That is not a labelling problem — it is evidence that replacing an interactive clinical tool with a static format leaves a real cognitive gap. Better "read-only" signposting helps, but the real fix is the future interactive concept. Testing gave us the data to make that case to the product team.
WHAT I WOULD DOCUMENT BETTER
The reasoning, not just the decisions
I documented what was chosen — but not always why alternatives were ruled out. A clear record of the landscape decision, the interactivity cut, and the structural tradeoffs is worth more than most design deliverables for whoever picks this project up next.
Having a Landscape page
Instead of a portrait page, A Landscape page would have made more area for the data to be beside the graphical screenshot for better reference between data and graph
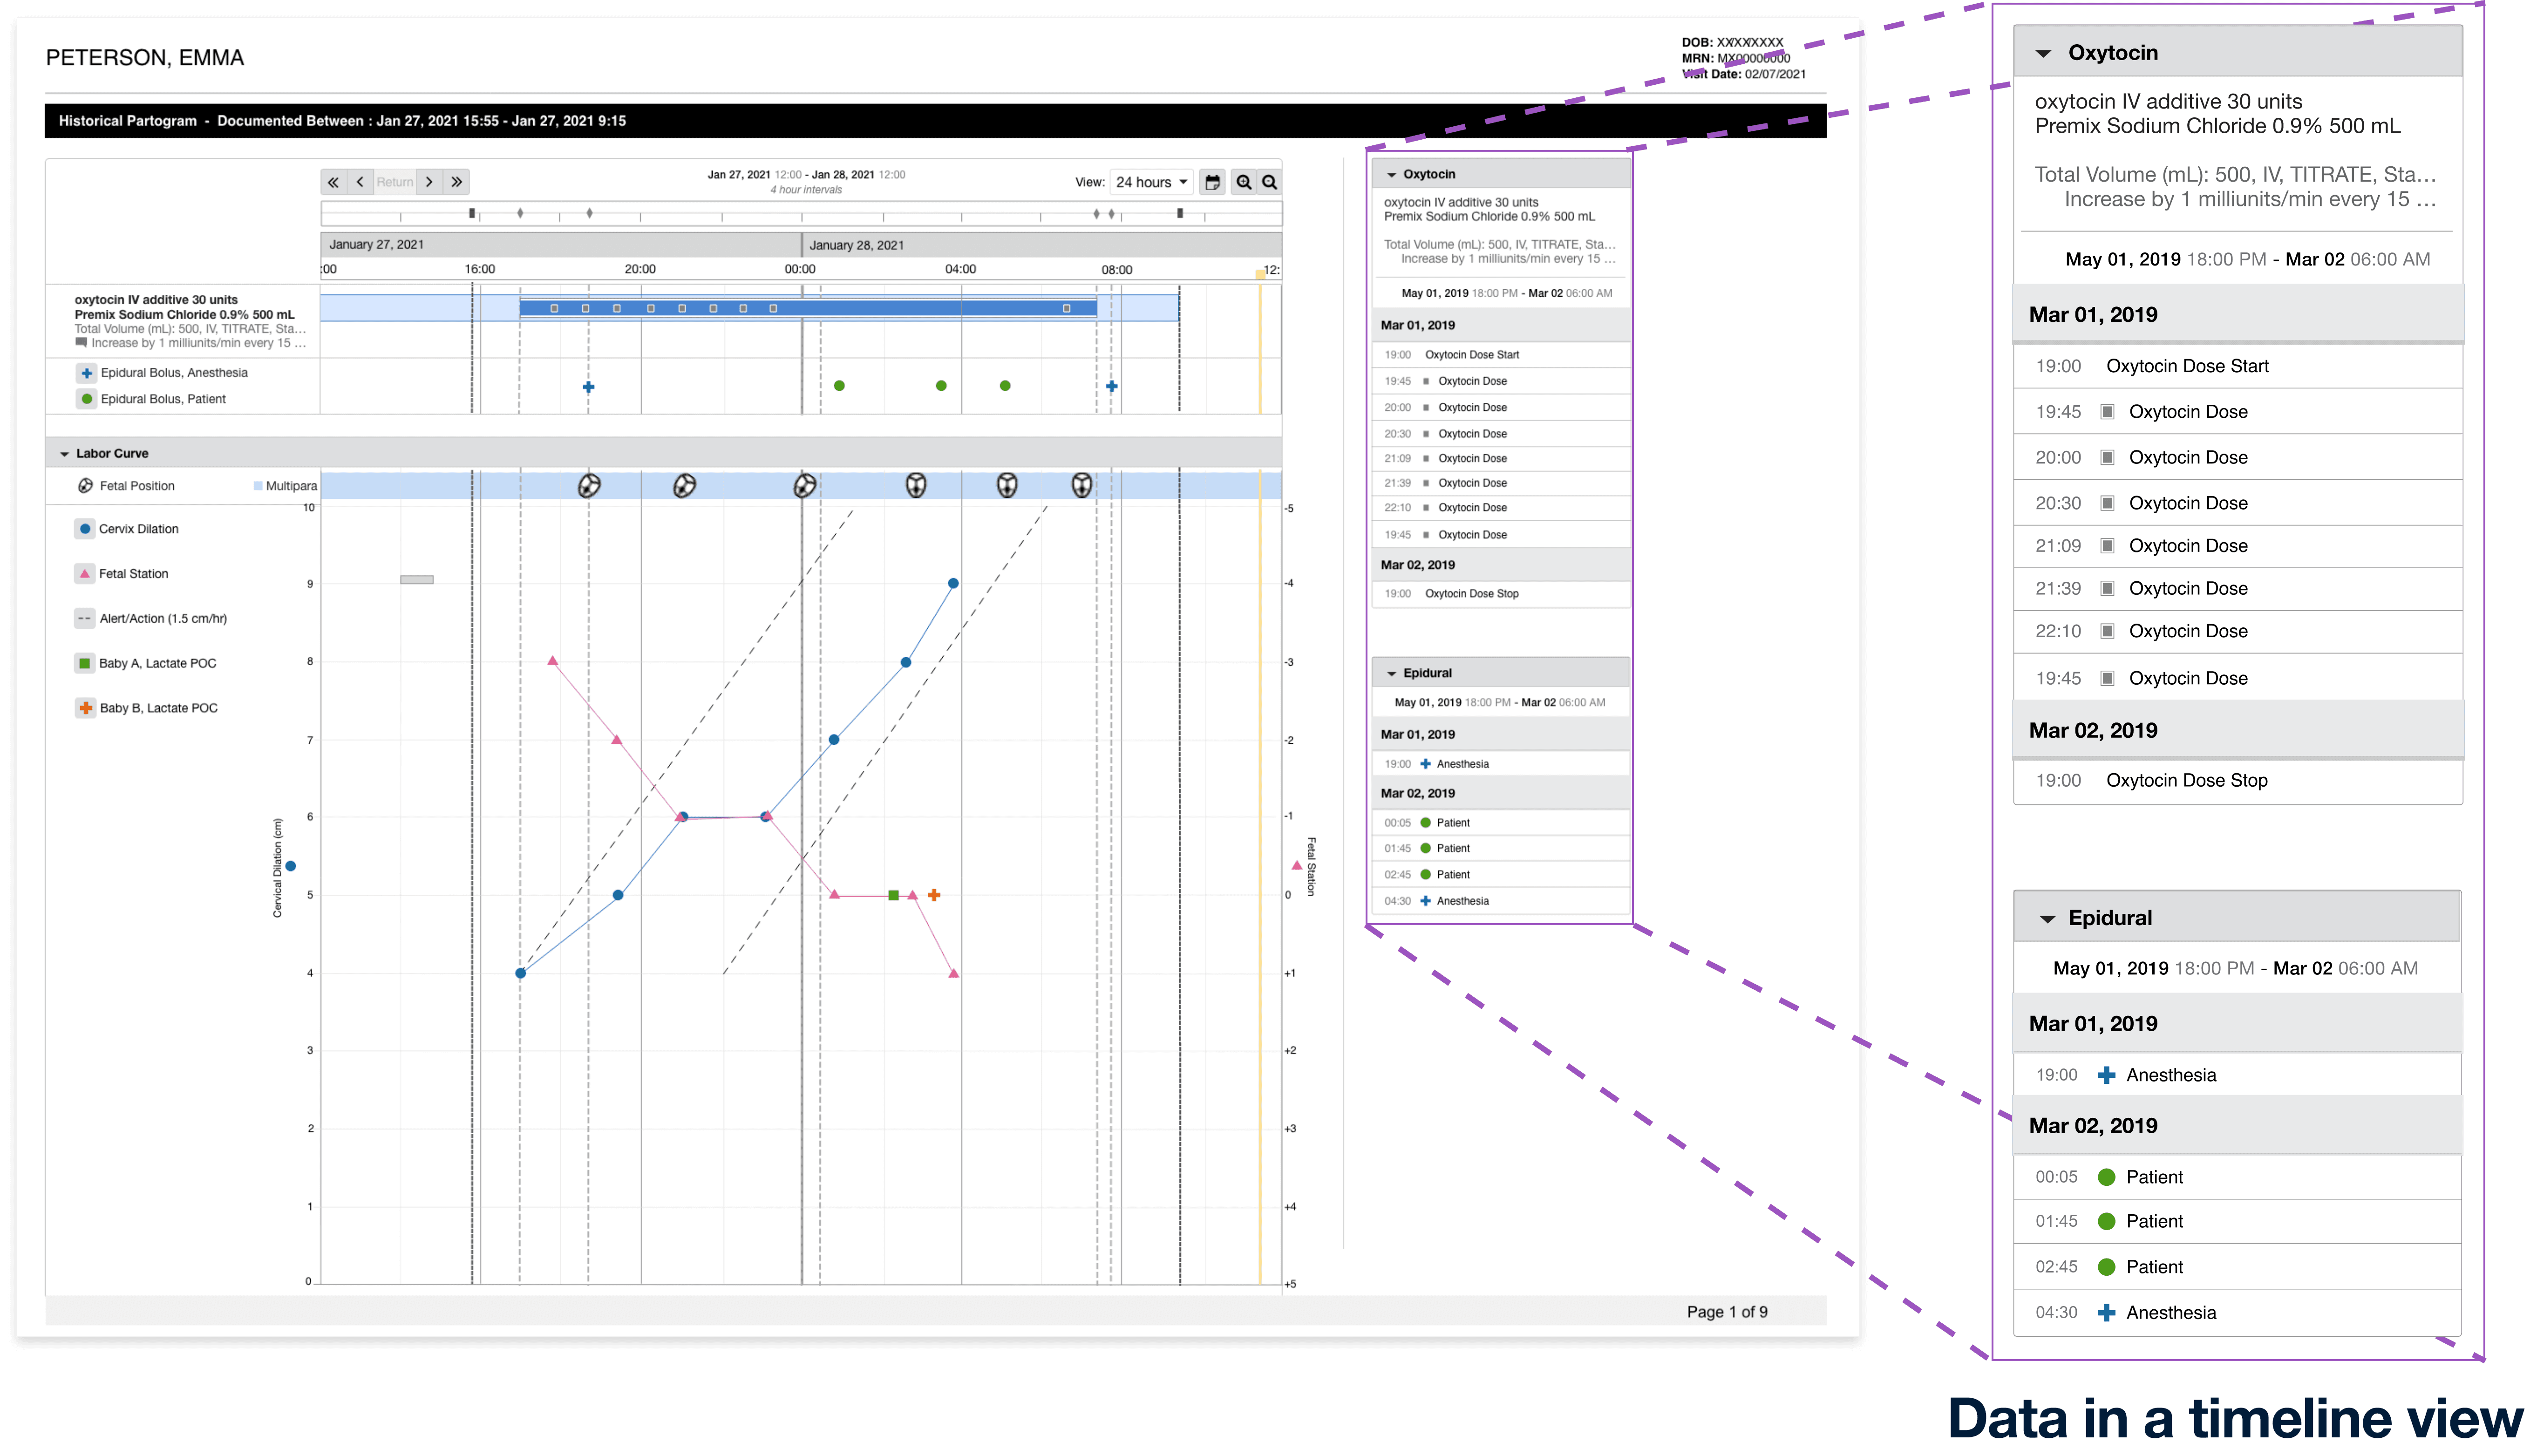
Data represented in a timeline view
A timeline looks much better than a table as it gives visual similarity of the plotted data points on the graph in a list type view.
With the use of AI
A summarised story could be added below which would also be easy to understand for the patients who might not understand what the data means.
(Should be marked as In-accurate as it would be computer generated)